


 Remember that story we did three weeks ago on the first study from SMU’s National Center for Arts Research? The one about NCAR’s attempt to quantify what constitutes success for an arts group – and how can it be encouraged and duplicated? Well, the study is finally up online. It may appear daunting at first — particularly the Introduction with its eight indices, its “Key Intangible Performance Factors” and its “conceptualizing the arts and culture ecosystem as a set of interdependent relationships.”
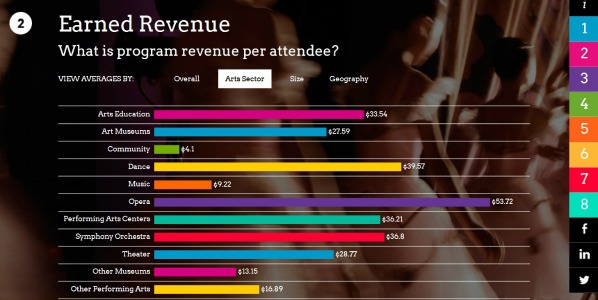
So skip all that mumbo-jumbo and start hitting the brightly colored buttons on the right. That’s where you’ll find the data spun out in easy-to-understand bar graphs and pie charts. That’s where the interesting stuff is: like, arts groups, on average, spend $4.11 on marketing per visitor. Four bucks of your ticket price was what it took to get you into the museum or into that theater seat. Or interesting stuff like, small organizations actually have more months’ worth of working capital to rely on (4.1) than the big guys (2.6).
OK, so maybe this is mostly interesting to arts nerds and managing directors. But you can have fun with it. You may learn a few things. We certainly did.
COMMENTS