


 SMU researchers, hard at work. Photos from Shutterstock.
Earlier this year, SMU announced the creation of the National Center for Arts Research. The center has just previewed its inaugural report, a major effort drawing on the largest arts database in the country. KERA’s Jerome Weeks reports some of the study’s conclusions are a little unexpected.
- KERA Radio story:
- Online story:
Zannie Voss is at her computer in her office at SMU; she’s a professor of arts management and the director of NCAR, the National Center for Arts Research. The purpose of NCAR is to determine what constitutes success for an arts group – and how can it be encouraged, duplicated?
Ordinary businesses have clear-cut yardsticks to measure their performance: profits, return on investment, stock prices. But what does high performance mean for a non-profit arts group? A bigger budget? A larger audience? A shiny new building?
On her computer screen, Voss pulls up the data on two different art museums. The smaller one has an annual budget of one million dollars. The bigger one is forty times that size. Yet NCAR’s study scores them about the same in terms of performance.
“So you would think,” Voss says, “‘Well, why do these two organizations have about the same score?’ And when you take everything else into account, you start seeing that, high performance would really mean that the big one over here, spending this much, should be getting a whole lot more attendance.”
The smaller art museum is simply more efficient. It draws only 200,000 people per year, while the big museum draws more than twice that. But remember, the big museum has forty times the budget. Much of that may be tied up in preserving a much larger permanent collection, but still, the museum offers many more shows, spends more on marketing. So it’s getting disappointingly little bang for all its big bucks.
What’s the smaller museum’s secret? That’s what NCAR is trying to determine. It’s compiled five years of data from such sources as the Census Bureau, the IRS, the National Endowment for the Arts and the Cultural Data Project. NCAR’s database includes more than 55,000 cultural groups and arts education programs in 44,000 zip codes across the country. The study tries to factor out the differences of size and wealth, public funding and community demographics to find things like how many local people a group engages as volunteers, how many world premieres does it present, what effects do these have?
Not surprisingly, there is no single, magic answer for what makes a thriving cultural organization. But when all these intangibles are bundled together, there is a term for what makes the difference.
Says Voss: “We all know organizations that have built stronger relationships with their communities, those that have a stronger reputation. All those intangibles come back to the issue of leadership. There are some qualities that leaders are able to deploy that draw individuals and artists to that organization.”
Voss believes leadership is particularly important in the arts field, more so than with ordinary businesses, and NCAR aims to quantify what an inspiring arts or managerial leader does, what factors help or hurt cultural performance.
Some of the study’s conclusions are no-brainers:
- Big corporations and lots of hotels and parks in a town often help arts groups’ bottom line — for the obvious reasons. More money, more tourists, more pleasant places to gather.
- Cultural organizations that have children’s programs often do better than those without.
- Bigger arts groups like symphonies and operas invest more money in actually supporting artists, which is one reason they can be vital to an arts community. A symphony needs a large contingent of full-time musicians just to function, so artists’ salaries make up a larger part of its budget than for many other kinds of cultural groups.
- The number of grants from the NEA or the Institute of Museum and Library Services that an organization receives has a positive impact on every performance factor.
But other conclusions that Voss draws seem counter-intuitive. The NCAR study, for instance, found that the younger end of the overall arts audience is actually growing. This, despite many reports about the graying of opera, symphony and theater audiences. The reason is the narrow focus of these latter reports.
“When we think of arts and culture,” explains Voss, “we have a tendency to go to traditional art forms — to think about opera, symphony — instead of thinking about the broader spectrum of nature and science museums. You’ve got community-based organizations and arts education.”
All of these institutions draw crowds that more than offset aging operagoers, for instance, who make up only two percent of the entire art market. This may not provide much consolation to opera and symphony companies, but it does suggest that younger audiences are not completely lost to video games.
Other surprises:
- Performance is lower in communities with a higher concentration of people with graduate degrees. A high number of college degrees overall has a positive effect, but factor out the bachelor’s degrees, and it seems people with advanced degrees, Voss speculates, may simply be too committed to their careers to attend many arts performances or museums.
- The same factor may hold for household income. Households making more than $200,000 annually contribute more to arts groups but they attend less, are engaged less — perhaps because of high-pressure work demands.
- Big cities have a positive effect on revenue and expenses, but big cities actually suppress attendance and total engagement. The reasons are complex. First, big cities tend to have professional sports teams and zoos — and those draw away audiences. In fact, big cities generally have more cultural offerings, period, which means there’s simply more competition. And those big cities that are built around freeway sprawl — like LA or Dallas — hinder arts attendance through long commute times. Long commutes bring down performance on nearly every outcome.
Ultimately, Voss says, the aim of NCAR is to let arts groups go online and compare their own stats with their peers. And to learn how to improve those stats. “I used to run professional theater companies,” she says. “My heart is in the art. So the numbers are not for the numbers’ sake, but because there will be more resources and more stable organizations to support artists and the creation of great art.
NCAR’s study will be online in a few days at smu.edu/artsresearch. The interactive version is planned to launch next summer.
The full release is below:
FIRST DATA-DRIVEN ASSESSMENT OF THE HEALTH OF THE NONPROFIT ARTS INDUSTRY TO BE RELEASED BY SMU’S NATIONAL CENTER FOR ARTS RESEARCH (NCAR)
NCAR Report Is First of Its Kind for the Arts, Built on Most Comprehensive Set of Data Ever Compiled
Study Identifies Performance Drivers and Determines Value of Managerial Expertise
DALLAS (SMU) – The National Center for Arts Research (NCAR) at Southern Methodist University in Dallas, Texas, has completed its inaugural report assessing the health of the nonprofit arts industry. A preview of the report was presented to an audience of arts community members in a meeting at SMU this evening, and the full report will be available online at smu.edu/artsresearch by November 20. The new report is built on the most comprehensive set of arts organization data ever compiled, integrating organizational and market-level data, and assesses the industry from multiple perspectives, including sector/art form, geography, and size of the organization. The NCAR report is the first of its kind for the arts, creating a data-driven assessment of organizations’ performances industry-wide and identifying drivers of performance.
NCAR is led by faculty at SMU’s Meadows School of the Arts and Cox School of Business in collaboration with the Cultural Data Project (CDP) and other national partners. The vision of NCAR, the first of its kind in the nation, is to act as a catalyst for the transformation and sustainability of the national arts and cultural community. In its first study, researchers were able to determine the extent to which managerial and artistic experience and decision-making impact an organization’s performance.
“NCAR is the first organization in the country to examine the performance of the arts industry from a statistical, data-driven perspective,” said José Bowen, dean of the Meadows School of the Arts. “Not only have we assembled the most comprehensive database and conducted the most in-depth analysis of the industry ever undertaken, but we are sharing these findings freely with the entire industry and providing tools for individual organizations to understand themselves and make changes to improve their performance. This is what makes the project unique – we are not just producing another index of how arts organizations are doing. The ultimate goal of NCAR is to improve the health of both individual organizations and the entire arts and culture ecosystem in the United States.”
To create the inaugural report, NCAR researchers integrated and analyzed data from the CDP and other national and government sources such as the Theatre Communications Group, the National Endowment for the Arts, the Census Bureau, and the National Center for Charitable Statistics. In doing so they created a spatial model of the arts and culture ecosystem of the U.S. The report measures performance on eight different indices: contributed revenue, earned revenue, expenses, marketing impact, bottom line, balance sheet, community engagement, and program activity. For each index, overall averages were calculated, as well as averages by sector, by organizational size, and by geographic area. These were broken down into nine different market clusters, including five cities identified as stand-alone markets (New York City, Washington, D.C., San Francisco, Los Angeles, and Chicago).
Beyond simply reporting on performance, the NCAR study evaluated specific drivers of performance and then, controlling for these drivers, NCAR was able to create a level playing field for all organizations in order to compare performance across organizations. From this, NCAR estimated how much of the remaining performance variation is attributable to intangible, difficult-to-observe-and-measure characteristics such as good decision-making and managerial or artistic expertise and how much is simply random variation.
NCAR draws on the academic expertise of Meadows and Cox faculty in the fields of arts management, marketing, and statistics. Dr. Zannie Voss, chair and professor of arts management and arts entrepreneurship in the Meadows and Cox schools, serves as NCAR’s director and Dr. Glenn Voss, the Marilyn R. and Leo F. Corrigan, Jr. Endowed Professor of Marketing at Cox, serves as research director.
“In this first report we took a deep dive into eight of the areas of performance identified, and by studying these averages, tried to answer the question ‘all else being equal, what makes one arts organization more successful than another?’ Some of the findings were as one would expect, but we did find some surprises,” said NCAR director Dr. Zannie Voss. “Perhaps more than any other industry, arts organizations are driven by managerial and artistic expertise. Being able to estimate the value of this expertise in an organization’s performance is the single most valuable result of our first study.”
In 2014, NCAR will launch an interactive dashboard, created in partnership with IBM, which will be accessible to arts organizations nationwide. Arts leaders will be able to enter information about their organizations and see how they compare to the highest performance standards in each of the eight indices for similar organizations. The website will also foster public discussion of best practices and solutions and offer a dedicated YouTube channel for video responses, as well as an online resource library with helpful tools and templates.
More than a dozen visionary foundations and individual arts patrons have supported the new center with financial investments, including the Communities Foundation of Texas, M. R. & Evelyn Hudson Foundation, Carl B. & Florence E. King Foundation, Jennifer and Peter Altabef, Marilyn Augur, Molly Byrne, Bess and Ted Enloe, Melissa and Trevor Fetter, Carol and Don Glendenning, Jeanne R. Johnson, Nancy Nasher, Nancy Perot, Bonnie Pitman, Caren Prothro, and Donna Wilhelm.
NCAR 2013 Report – Highlights
A sampling of highlights from the study:
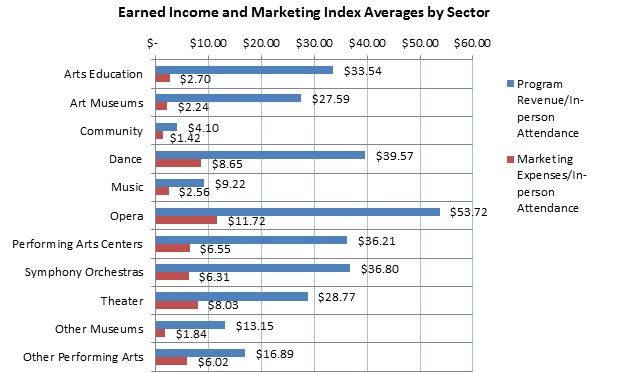
• Arts and cultural organizations earned an average of $22.26 per person who participated in the organization’s program offerings, with a wide spectrum when broken down by sector: from a low of $4.10 for community organizations to a high of $53.72 for opera companies, reflecting the differences in operating models.
• The larger the organization, the higher the percentage of its operating revenue that goes to pay for artistic and program personnel compensation, and the greater the tendency to run a deficit.
• The smaller the organization, the higher the level of expenses it covers with contributed revenue.
• San Francisco had the highest arts and culture dollar activity per capita—$895—followed by New York City and Washington, D.C., at roughly $610 each.
• Organizations in the Los Angeles area have the highest levels of unrestricted contributed revenue covering total expenses, the highest program revenue per attendee, and spend more in marketing expenses to bring in each attendee than other clusters, while Chicago organizations spend the lowest amount to bring in every attendee, followed by New York.
Based on the averages for each index, NCAR researchers were able to identify some factors that drive performance, including:
• Organizational age and size (total expenses) boost performance in every case.
• More local, national, or world premieres all lead to higher attendance and higher levels of total engagement.
• Organizations that target children (pre-K – 12) tend to have a larger footprint, offering more programs on larger budgets and attracting more attendance and more total engagement.
• Organizations that spend more on fundraising (including personnel) have higher contributed and total operating revenue, but also more offerings, more total engagement, and higher current assets.
• Population has a positive effect on operating revenue, expenses, and total offerings, but a negative relationship with attendance and total engagement.
• Households with annual income above $200,000 tend to provide more contributed revenue to local arts and cultural organizations and they drive up expenses, but they have no effect on either attendance or program revenue and they drive down total engagement.
• Longer commute times in a community bring down performance on nearly every outcome.
• Attendance is lower as median age in the market increases. It appears that attendance is driven more by those in the lower end of the 25-64 range.
• Having more hotels in the market led to higher performance on nearly every measure.
• More per capita operating revenue in an arts sector translates to higher performance on every measure for organizations in that sector. When there are more competitors per sector, contributions are spread thinner, budgets tend to be smaller, and each organization supplies fewer offerings. However, more competition does not lead to lower attendance or engagement.
• Higher concentrations of larger corporations in the community boost marketing expenses, physical attendance, total expenses, and program salaries. There is a “big company” effect that impacts arts and culture.
• The number of NEA and/or IMLS grants an organization receives has a positive effect on every performance outcome.
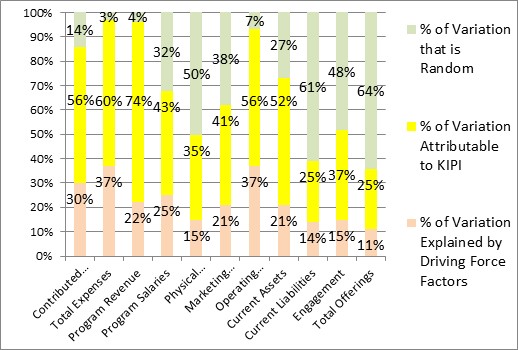
Although the performance drivers explain some level of variation in performance measures, there are intangibles, like managerial and artistic experience, that also affect performance. These Key Intangible Performance Indicators (KIPIs) can be measured only after taking into account an organization’s sector, size, location, community characteristics, local cultural policy, etc., and creating a level playing field. There is still some random variation that can’t be accounted for, but NCAR gets as close as possible to measuring how much of an impact KIPIs have on performance. The KIPIs are most valuable as a tool in examining an individual organization’s performance on different outcomes relative to the rest of the field, all else being equal.
Explained Variation and Unexplained Variation Attributable to KIPI and Random Variation
Pingback: SMU’s Major New National Arts Report: What Does Arts Leadership Do? | Survey of Arts Management()
Pingback: Around the horn: healthcare.gov edition | Createquity.()